Showing posts with label Analysis Methods. Show all posts

Sunday, January 6, 2008

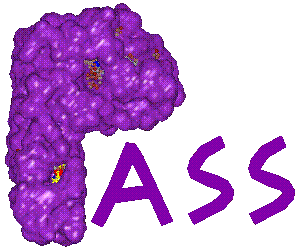
PASS


Putative Active Sites with Spheres

PASS (Putative Active Sites with Spheres) is a simple computational tool that uses geometry to characterize regions of buried volume in proteins and to identify positions likely to represent binding sites based upon the size, shape, and burial extent of these volumes. PASS'S utility as a predictive tool for binding site identification is tested by predicting known binding sites of proteins in the PDB using both complexed macromolecules and their corresponding apo-protein structures. The results indicate that PASS can serve as a front-end to fast docking. The main utility of PASS lies in the fact that it can analyze a moderate-size protein (~ 30 kD) in under twenty seconds, which makes it suitable for interactive molecular modeling, protein database analysis, and aggressive virtual screening efforts. As a modeling tool, PASS (i) rapidly identifies favorable regions of the protein surface, (ii) simplifies visualization of residues modulating binding in these regions, and (iii) provides a means of directly visualizing buried volume, which is often inferred indirectly from curvature in a surface representation.

Ref: http://www.ccl.net/cca/software/UNIX/pass/overview.shtml

Sunday, September 16, 2007

Wavelet Coherence and Its Application in Analyzing Auditory and Motor Task Event-Related Potentials

WU Jie,ZHANG Ning,YANG Zhuo,ZHANG Tao, Wavelet coherence and its application in analyzing auditory and motor task event-related potentials.

This paper has been accepted by ACTA BIOPYSICA SINICA,here is its abstract.

Related links:Tips about Wavelet , Wavelet Coherence Method,A Vivid Example to Show How Wavelet Coherence Works, Some Concepts about ERP signals ,Wavelet and EEG Signals. These links can help to gain further information about this paper.

Abstract:
Wavelet coherence method is applied in analyzing single trial of ERP (event-related potential). There are three groups of experiments: auditory single task, motor single task 1 and motor single task 2. Data from 12 participants is analyzed around 40 Hz by wavelet coherence method and the coherence values between prefrontal area and other areas in the brain are calculated. It is found that the coherence values in motor tasks are larger than those in auditory task and there are significantly differences. Furthermore, in different tasks, the distributions of the coherence values are obviously different, and the values are changing in particularly ways according the varying of the time. This analysis indicates that wavelet coherence method has its advantages in investigating short time EEG signals.

Brief descriptions:


The coherence values, around 40Hz between prefrontal area and other areas in the cerebral cortex, were measured. It was found that the coherence values in the MST (Motor Single Task) are larger than that in the AST (Auditory Single Task) with significant differences.Brain dealing with complicated tasks can have more information to process, and there should be more information communication between different areas of the brain. This can be denoted by coherence values.


Wavelet Coherence Values along the time axis. The colors in the images indicate the coherence values between prefrontal area and other areas in the cerebral cortex around 40Hz(the relationship between the color and the value is shown in the color-bar).large coherence values exactly locate in Auditory Cortex at temporal lobe in AST conditions, whilst in MST conditions, the big values are in motor cortex which is in parietal area.

The data show that the wavelet methods calculations of non-stationary signals, compared to the Fourier methods, can characterize the time-frequency features of neural mechanisms underlying cognitive control. Furthermore, wavelet approach can provide higher resolution in both temporal and spatial scales and can be applied in analyzing other physiological signals.

Main reference:
Lachaux, J.-P., et al., Estimating the time-course of coherence between single-trial brain signals: an introduction to wavelet coherence. Neurophysiol Clin., 2002. 32: p. 157-174.

A Vivid Example to Show How Wavelet Coherence Works

Some formulas have been given in previous article, but they are not friendly to understand. Now there is a vivid example to show what Wavelet Coherence analysis looks like.

Please pay attention to the differences of the two pictures below. The description following the pictures will tell you the details.

a


b
Two signals in experiments were randomly chosen and a synchronization in 2~3 s and 10~40Hz was created between them. Then the Wavelet Coherence values were calculated. (a) result of the signals without artificial synchronization, (b) result of the signals with artificial synchronization. The color-bar in the right shows the relationship between coherence values and the colors. High coherence values can be seen in area with designed synchronization (2~3 s and 10~40Hz).

References of this article:
Lachaux J-P, Lutz A, Rudrauf D, Cosmelli D, Quyen MLV, Martinerie J,Varela F. Estimating the time-course of coherence between single-trial brain signals: an introduction to wavelet coherence. Neurophysiol Clin., 2002, 32: 157-174.

Wavelet Analysis of ERP Recordings for Dual Tasks in Man

WU J, YANG Z, ZHANG T, Wavelet analysis of ERP recordings for dual tasks in man.

This paper has been accepted by ICCN'07 & SICPB'07 which will be held in Shanghai, China during November 17-21, 2007. The abstract is shown as below.

Click Wavelet Packet Transform, Relative Wavelet Energy, ERP for more relevant information.

Abstract:
The study was to examine the application of wavelet packet method to electrophysiological responses recorded during single and dual task performance. Relative energies of both EEG alpha and beta frequency bands were significantly higher in the single task conditions compared with that of the dual task condition (P is less than 0.05). The data demonstrated that relative energy measurements based on wavelet transform could be a useful alternative approach to analyzing short duration EEG signals on a time scale of seconds.

It is impossible and unnecessary to show the details of this paper in a single short article, so only the abstract is shown here.

The most important point is that, compared to the Fourier methods, wavelet method can be an alternative and much better method to deal with short time EEG signals. Accordingly, wavelet method can be used in analyzing other data in our lab, those data include EEG, ERP and RSNA signals. They are all complicated signals and represent nonlinear dynamic systems with high dimensionality.

There will be other artcles in this blog to illustrate the advantages of Wavelet method compared to regular frequency analysis methods.

Relative Wavelet Energy

It is only a short introduction about Relative Wavelet Energy. Click here for some basic information about wavelet.

The energy of a discrete signal s(k) is defined as


and the relative energy is defined as


where is the total energy, which is calculated by adding here(Rosso, et al., 2006).

Rosso, O.A., Martin, M.T., Figliola, A., Keller, K. and Plastino, A. (2006) EEG analysis using wavelet-based information tools, Journal of Neuroscience Methods, 153, 163-182.

Wavelet Packet Transform

The wavelet packet transform (WPT) represents a generalization of the wavelet methods and it has recently been applied to various science and engineering fields with great success. Here are some tips about WPT from Matlab tutorial.

From WT to WPT:

In wavelet analysis, a signal is split into an approximation and a detail. The approximation is then itself split into a second-level approximation and detail, and the process is repeated. For an n-level decomposition, there are n+1 possible ways to decompose or encode the signal. More basic information about wavelet can be got here.

In wavelet packet analysis, the details as well as the approximations can be split.


The wavelet decomposition tree is a part of this complete binary tree. For instance, wavelet packet analysis allows the signal S to be represented as A1 + AAD3 + DAD3 + DD2.

Here is a sample transform of an EEG signal in our lab. The original waveform was decomposed into five waveforms in WPT method, db5 mother wavelet was employed and 7 levels decomposition was taken. We can see DELTA, THETA, ALPHA, BETA, GAMMA waves in this figure.

Wavelet and EEG Signals

EEG signals are wildly studied to determine how patterns contained within them might reflect control by the nervous system. Generally, they are investigated with frequency analysis based on FFT. However, EEG data sets (including signals in ERP experiments) are non-stationary in both time and space. And FFT is not good at analyzing waveforms with this feature,see this article.

The main advantage of wavelet transform (WT) in the analysis of EEG signals is that it allows accurate decomposition of a neuro-electrical record into a set of component waveforms (detail functions). These detail functions can isolate all scales of waveform structure, from the largest to smallest pattern of variation in time and space that is available in the signal. Consequently WT provides flexible control over the resolution with which different activities and events contained in the neuroelctrical signal can be localized in time, space and scale. This leads to several important applications like(Samar, et al., 1999): (a) noise filtering and signal separation; (b) preprocessing neuroelectric data; (c) neuroelectric signal compressions; (d) spike and transients detections; (e) component and event detection; (f) time-scale and space-scale analysis of neuroelectric waveforms; among others(Rosso, et al., 2006).

Many details have been reviewed by Samar(Samar, et al., 1999).


Rosso, O.A., Martin, M.T., Figliola, A., Keller, K. and Plastino, A. (2006) EEG analysis using wavelet-based information tools, Journal of Neuroscience Methods, 153, 163-182.
Samar, V.J., Bopardikar, A., Rao, R. and Swartz, K. (1999) Wavelet analysis of neuroelectric waveforms: a conceptual tutorial, Brain Lang, 66, 7-60.

Friday, September 7, 2007

Wavelet Coherence Method

The coherence function is a direct measure of thecorrelation between the spectra of two random processes. Fourier method can provide accurate estimates of stationary signals. However, Most signals ( including our signals from brains) are non-stationary waveforms.

Wavelet coherence method was first used in physics to estimate interactions among non-stationary signals, now it has been applied in investigating neuroelectric waveforms such as EEG signals.

First of all, signals are decomposed along the Morlet wavelet family, the advantage of which is that it is simple and well suited for spectral estimations. It is defined for frequency f and time τ by:

The wavelet transform of a signal x(u) is a function of time (τ) and frequency ( f ) given by the convolution of x with this wavelet family:


From the wavelet transforms of two signals x and y, we can define the wavelet cross-spectrum between x and y around time t and frequency f

Whereδis an important parameter which depends on the frequency

Finally, analogous to the Fourier-based coherence, the wavelet coherence WCo(t, f) is defined at time t and frequency f by:

WCo(t, f) takes its values between 0 and 1, the bigger this value, the more dependence between x and y around time t and frequency f.

NOTE: It is a brief introduction of Wavelet Coherence Method. For further information about this method, please refer to relevant papers.

References of this article:
Lachaux J-P, Lutz A, Rudrauf D, Cosmelli D, Quyen MLV, Martinerie J,Varela F. Estimating the time-course of coherence between single-trial brain signals: an introduction to wavelet coherence. Neurophysiol Clin., 2002, 32: 157-174.
Li X, Yao X, G J, Jefferys,Fox J. Interaction Dynamics of Neuronal Oscillations Analysed Using Wavelet Transforms. J. Neurosci. Methods, 2007, 160(1): 178-185.

Wednesday, September 5, 2007

Tips about Wavelet

This introduction about Wavelet is summarized from matlab wavelet tutorial, for this tutorial, in my opinion, is concise and easy to understand.

From Fourier to Wavelet

Fourier method is the most well-known method for signal analysis. It breaks down a signal into constituent sinusoids of different frequencies, in other words, it transforms the signals from time-based to frequency-based.

Fig.1 Fourier Transform

Although this useful technique has been wildly used by people for a long time, it has a serious drawback: time information is lost during the transform, thus Fourier is not suited to detecting nonstatinary signals, such as EEG.

In an effort to correct this deficiency, Dennis Gabor (1946) adapted the Fourier transform to analyze only a small section of the signal at a time -- a technique called windowing the signal. Gabor's adaptation, called the Short-Time Fourier Transform (STFT), maps a signal into a two-dimensional function of time and frequency.


Fig.2 Short Time Fourier Transform

However, in STFT a particular size for time window should be chosen, the drawback is that this window can not provide a flexible analysis for all frequencies.

Wavelet analysis represents the next logical step: a windowing technique with variable-sized regions. Wavelet analysis allows the use of long time intervals where we want more precise low-frequency information, and shorter regions where we want high-frequency information.

Fig.2 Wavelet Transform

NOTE: Most of the information in this article comes from MATLAB tutorial, many thanks for MATLAB! The knowledge here are only basic tips, so if you want more details, see relevant books or papers please!